RESULTS
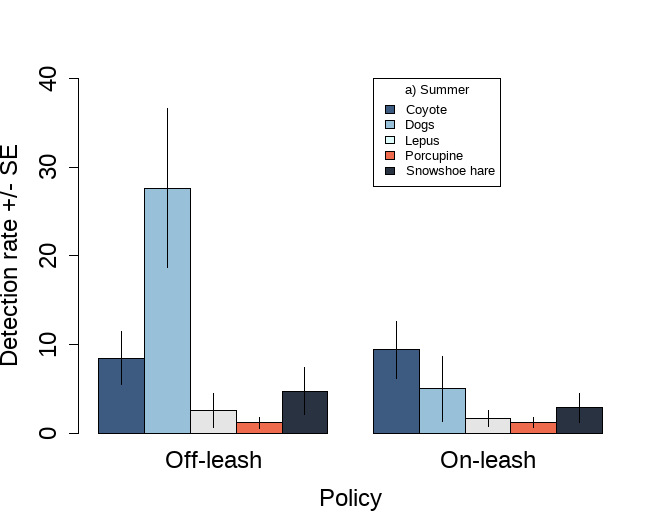
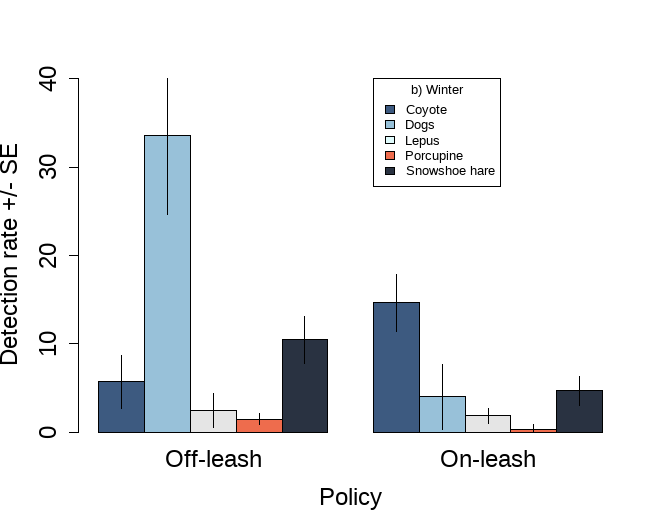
I calculated the detection rate as the number of detections by the survey effort multiplied by 100 (Jenks et.al. 2011; Farmer and Allen 2019). Over the 4-year study period, 17 camera traps were operating and documented 8077 independent events of 5 mammal species. To compare the focal species' detection rates, a grouped bar chart was plotted with standard error bars to visualize the results (Figure 6). The results showed that for both seasons, the detection rate of coyotes was higher in on-leash parks (Summer: mean = 9.39, SE = 3.21; Winter: mean = 14.6, SE = 7.65). During the summer (Figure 6a), the detection rates of porcupines (on-leash: mean = 1.16, SE = 0.57; off-leash: mean = 1.18, SE = 0.61) and Lepus sp (on-leash: mean = 1.64, SE = 0.87; off-leash: mean = 2.50, SE = 1.92) did not differ between the two types of parks. On the contrary, the detection rate of Snowshoe hares was higher in off-leash parks (mean = 2.50, SE = 1.92) compared to on-leash parks (mean = 1.64, SE = 0.87).
|
|
Figure 6. Average detection rate (number of detections per 100 camera-trap days) +- SE during the Summer (A) and Winter (B).
The ANOVA (Table 2a) showed a significant effect of the variable species on the detection rate (F = 5.435, p = 0.01) during the summer months. There was also a significant effect of policy on the detection rate (F = 3.915, p = 0.053), although this effect was weaker than the effect of species. In addition, there was a significant interaction between species and policy on detection rate (F = 3.535, p = 0.013). These findings suggest that both the natural history of the species and the policy in place (on-leash or off-leash) may influence the detection rate of the focal species.
As for the winter season (Table 2b), results suggest a non-significant effect of the variable species (F = 2.014, p = 0.108) and the type of policy on the detection rate (F = 1.639, p = 0.207). However, there is a significant interaction between species and policy on detection rate (F = 2.469, p = 0.058). These results suggest that neither the natural history of the species nor the policy in place (on-leash or off-leash) has a strong effect on the detection rate of the focal species during the winter. Other factors may be more influential in determining the detection rate.
As for the winter season (Table 2b), results suggest a non-significant effect of the variable species (F = 2.014, p = 0.108) and the type of policy on the detection rate (F = 1.639, p = 0.207). However, there is a significant interaction between species and policy on detection rate (F = 2.469, p = 0.058). These results suggest that neither the natural history of the species nor the policy in place (on-leash or off-leash) has a strong effect on the detection rate of the focal species during the winter. Other factors may be more influential in determining the detection rate.

Table 2. ANOVA results comparing the detection rates based on the variable species and type of policy in place (on-leash/off-leash). The following are reported: degrees of freedom (DF), the sum of squares (SUM SW), F-value, and P-value (Pr(>F). Significance level of p < 0.05
The summer interactions plot (Figure 7a) shows that the detection rate was significantly affected by the interaction between the variables species and policy (F = 3.535, p = 0.013). Specifically, the plot shows that the effect of on-leash/off-leash bylaws on detection rate differed between species, with some species showing a stronger negative relationship than others. This suggests that natural history may play a role in determining the sensitivity of the focal species to free-roaming dogs in urban parks. During the summer, coyotes were detected at a higher rate in on-leash parks (mean = 9.39, SE = 3.21) than in off-leash parks (mean = 8.43, SE = 2.99). However, the opposite trend was observed for domestic dogs, with a lower detection rate in on-leash parks (mean = 4.99, SE = 3.66) compared to off-leash parks (mean = 27.6, SE = 9.01). The lines in the interaction plot intersect for these species, suggesting a possible interaction between them affecting the detection rate.
During the winter (Figure 7b), the detection rates of coyotes and snowshoe hares in on-leash and off-leash parks had a complex relationship, as shown by the negative interaction in the plot. The coyote detection rate in on-leash parks was higher (mean = 14.6, SE = 7.65) than in off-leash parks (mean = 5.68, SE = 1.71). Conversely, the snowshoe hare detection rate in on-leash parks (mean = 4.67, SE = 2.14) was lower than in off-leash parks (mean = 10.4, SE = 5.83). It is also shown in the plot a negative interaction between the detection rates of coyotes and dogs (on-leash: mean = 4, SE =2.81; off-leash: mean = 33.6, SE =13.54).
During the winter (Figure 7b), the detection rates of coyotes and snowshoe hares in on-leash and off-leash parks had a complex relationship, as shown by the negative interaction in the plot. The coyote detection rate in on-leash parks was higher (mean = 14.6, SE = 7.65) than in off-leash parks (mean = 5.68, SE = 1.71). Conversely, the snowshoe hare detection rate in on-leash parks (mean = 4.67, SE = 2.14) was lower than in off-leash parks (mean = 10.4, SE = 5.83). It is also shown in the plot a negative interaction between the detection rates of coyotes and dogs (on-leash: mean = 4, SE =2.81; off-leash: mean = 33.6, SE =13.54).
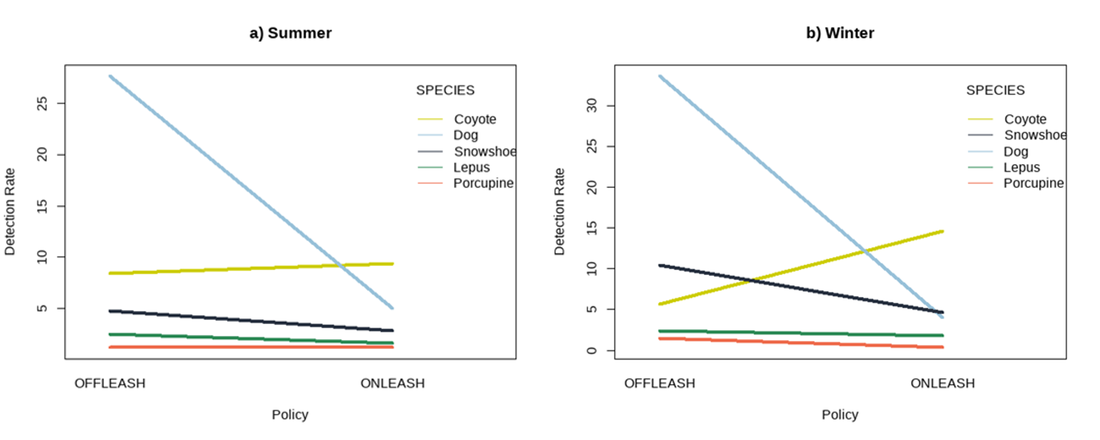
Figure 7. Line graph showing the relation between capture rates of each focal species in on-leash and on leash parks during the Summer (A) and (Winter).
Following the ANOVA, pairwise comparisons were conducted to determine if the detection rates of the focal species differed in on-leash and off-leash parks during the summer and winter. A Tukey's HSD test was used, with a significance level of p < 0.05. The results of the pairwise comparisons are shown in Table 3. I predicted that parks with on-leash policies would see greater predator habitat use (greater detection rate); however, this prediction was not supported by the data. For our focal species, the difference in average detection rate within both types of parks was deemed to be non-significant during the summer and winter. For dogs, there was a significant difference between the means of detection rates in on-leash (p < 0.05) and off-leash parks (p < 0.05). During the summer, the estimate of the difference in on-leash and off-leash parks was 22.68 detections per 100 days, and during the winter, 29.59 detections per 100 days.
Table 3. Estimates and SE of the comparisons between detection rates for each species at on-leash and off-leash parks during the Summer (A) and Winter (B) using a Tukey's HSD with a significance level of p < 0.05.

CONCLUSIONS
These findings suggest that it is important to be cautious when making broad conclusions about the impact of policies regarding non-wildlife populations in urban areas. Results show a significant effect of the variable species on the detection rate during the summer and the opposite result during the winter. However, non-significant results should be taken with caution due to the inherent imperfect detection of camera traps. There are two potential reasons why camera traps may not detect certain individuals or species: (1) they may not enter the small area being monitored by the cameras, or (2) they may pass through the monitored area but not be detected by the cameras due to various factors such as lighting or positioning (McIntyre et al., 2020).
Although the pairwise comparison showed non-significant differences in focal species’ use of on-leash and off-leash parks, other analyses could be helpful to further assess if the policies have effects on wildlife populations. Daily patterns of activity - the distribution of a species' activities over a 24-hour cycle- to explore overlaps within and between species as well as possible temporal niche partitioning (Frey et al., 2017). Therefore, in order to make effective conservation decisions, it is important to consider not just how different species are distributed in space, but also how they are separated in time.
Although the pairwise comparison showed non-significant differences in focal species’ use of on-leash and off-leash parks, other analyses could be helpful to further assess if the policies have effects on wildlife populations. Daily patterns of activity - the distribution of a species' activities over a 24-hour cycle- to explore overlaps within and between species as well as possible temporal niche partitioning (Frey et al., 2017). Therefore, in order to make effective conservation decisions, it is important to consider not just how different species are distributed in space, but also how they are separated in time.
