DATA TABLE
Data table (Table 1) contains information on wildlife detections at on-leash (10 camera sites) and off-leash (7 camera sites) parks in the city of Edmonton. The data were collected using camera traps deployed at various locations within the parks. The response variable in this table is the number of detections recorded by each camera, and the predictor variable is the type of park (on-leash or off-leash). Focal species were selected based on a detection count >10 in both seasons. The table includes data from cameras and provides a record of the focal species detection at each camera site from 2018-2021. All analyses were conducted using R software 4.2.2 (R Core Team 2022).
Table 1. Data table of the independent detections collected from 17 camera traps deployed in on-leash and off-leash parks in the City of Edmonton (Alberta, Canada). Variables: Count_Sp (Number of individuals in each image), Station (ID of the site) and Policy (On-leash/off-leash policy in place in that park)

EXPLORATORY GRAPHICS
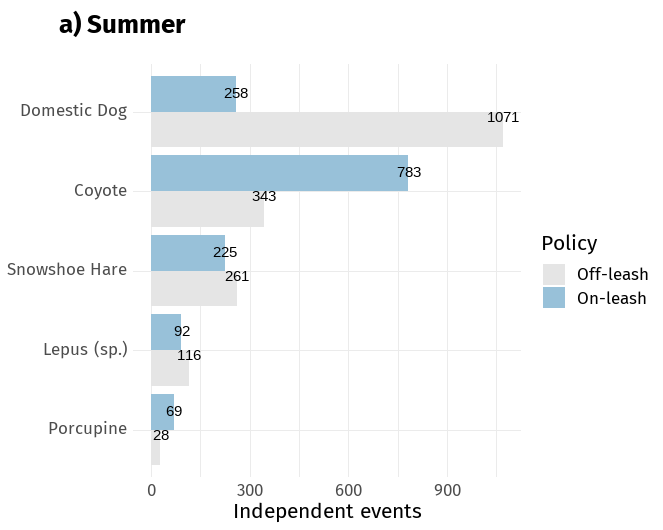
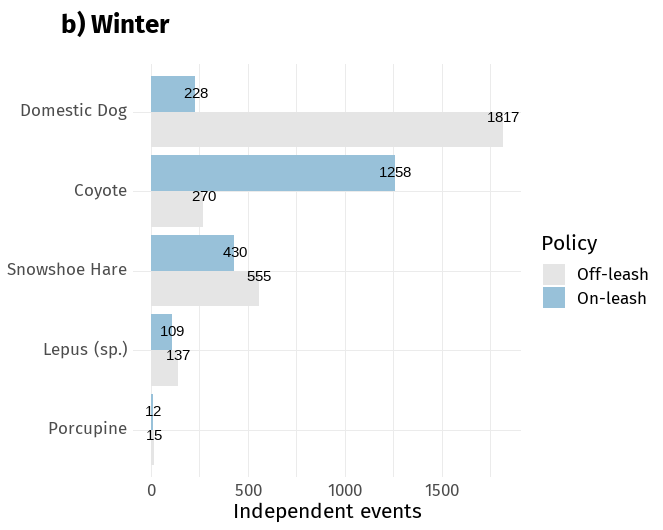
I explored the data following a 4 steps approach. First, I checked for missing values in R and plotted a bar chart with the independent detections of each species during the summer and winter to check for consistency (Figure 3). For both seasons, coyote was the most detected species in on-leash parks (Summer = 783, Winter = 1258), while dogs had a greater number of detections in off-leash parks (Summer= 1071, Winter = 1817. During the summer (Figure 3a), snowshoe hares (on-leash=225, off-leash=261), Lepus (on-leash=92, off-leash=116), and porcupines (on-leash=69, off-leash=28), were detected with lower frequencies, following a similar trend during the winter (Figure 3b).
|
|
Figure 3. Independent detections of the focal species in on-leash (10 camera traps) and off-leash parks (7 camera traps) during the summer and winter (2018 – 2021).
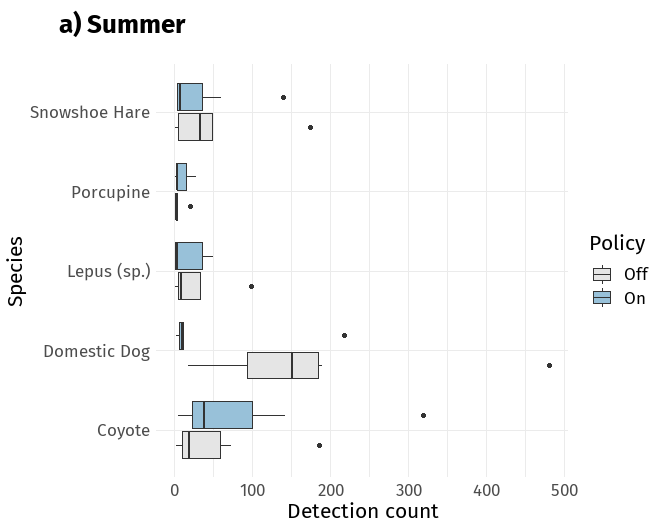
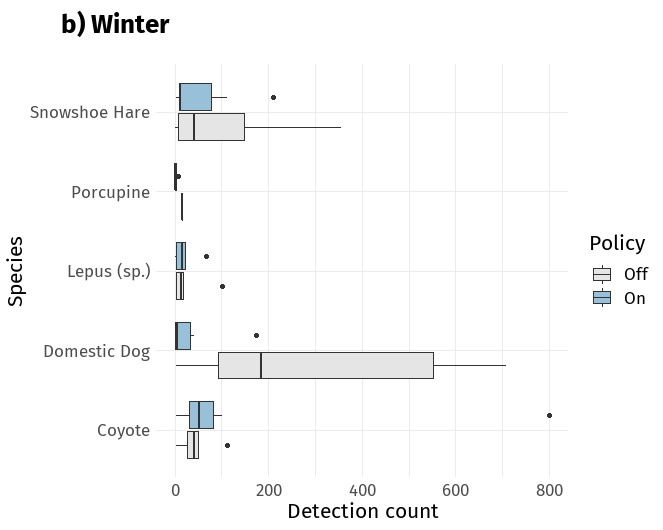
Following these two steps, I used a boxplot (Figure 4) to check for extreme values or outliers. Overall, the boxplots show that the median detections differed between on-leash and off-leash parks. During the summer (Figure 4a), the median detection count of coyotes is lower in off-leash parks. Conversely, Snowshoe hare and Lepus sp. showed a larger median in off-leash parks. During the winter (Figure 4b), the snowshoe hare detection count exhibits asymmetry in its distribution showing a longer tail on the higher end. For both seasons, outliers are visualized, with the detection count showing extreme values on the higher end.
|
|
Figure 4. Boxplot displays distribution of the focal species detection counts in on-leash and off-leash parks (Summer and Winter).
Last, I created a residual plot (Figure 5) to check if they were normally distributed. The residuals are shown on the y-axis, and the predicted values of detection counts are shown on the x-axis. The plot of the residuals was visually inspected, and for both cases (Summer and Winter), residuals were not symmetrically distributed around zero. This could indicate that the assumption of normality is not met, and residuals are non-normally distributed.
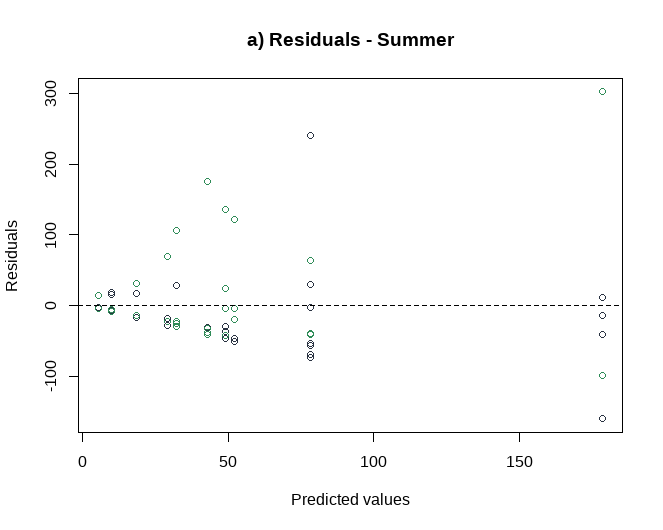
|
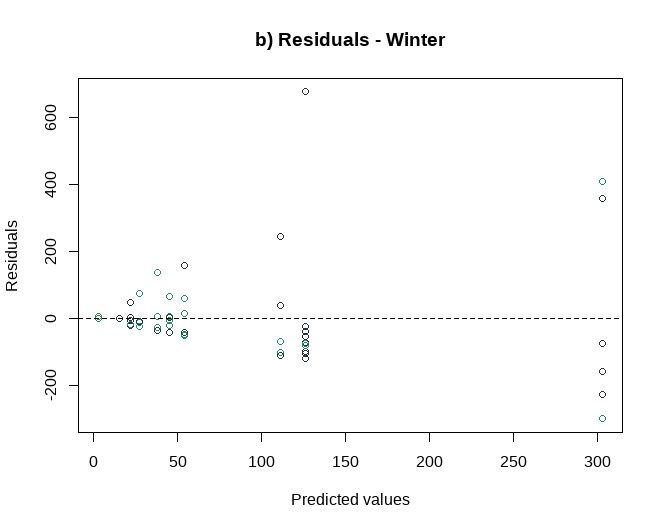
|
Figure 5. Residuals plot (predicted values of the number of independent events in the x-axis) showing a non-symmetrical distribution around zero during the Summer (A) and Winter (B).
